5. Snowfall
Information design / 2017
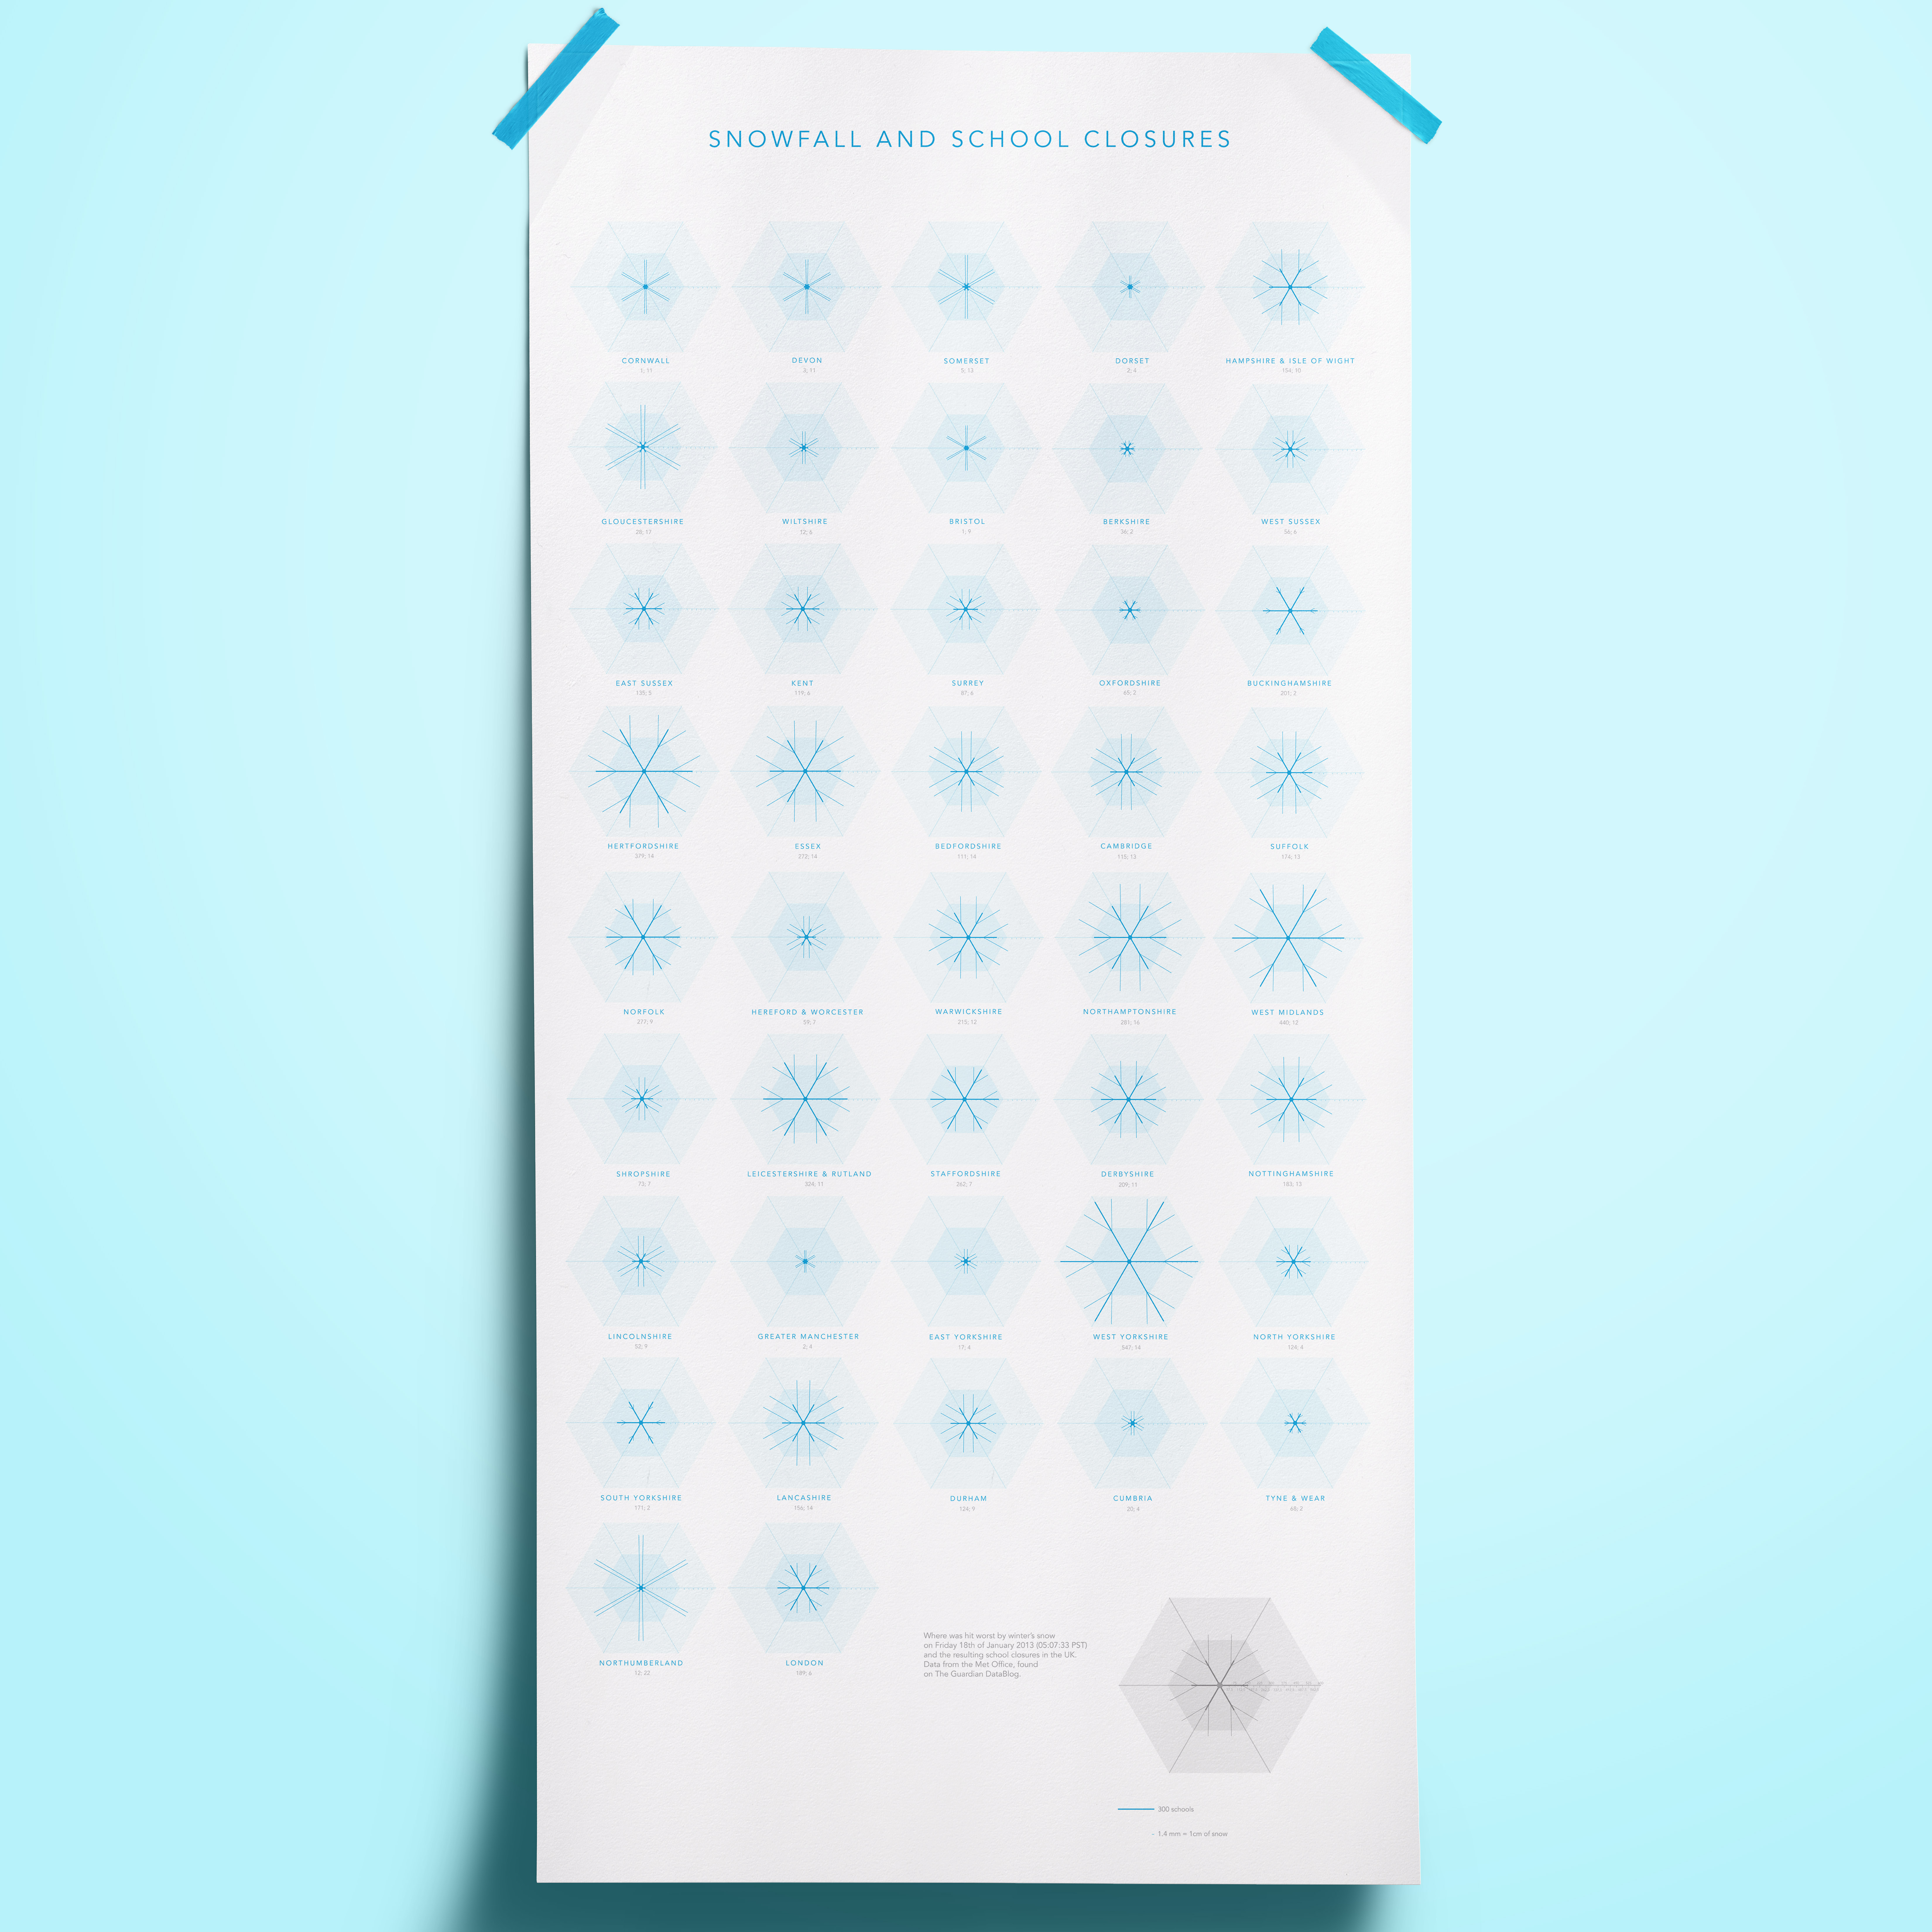
Snowfall and School Closures University Project
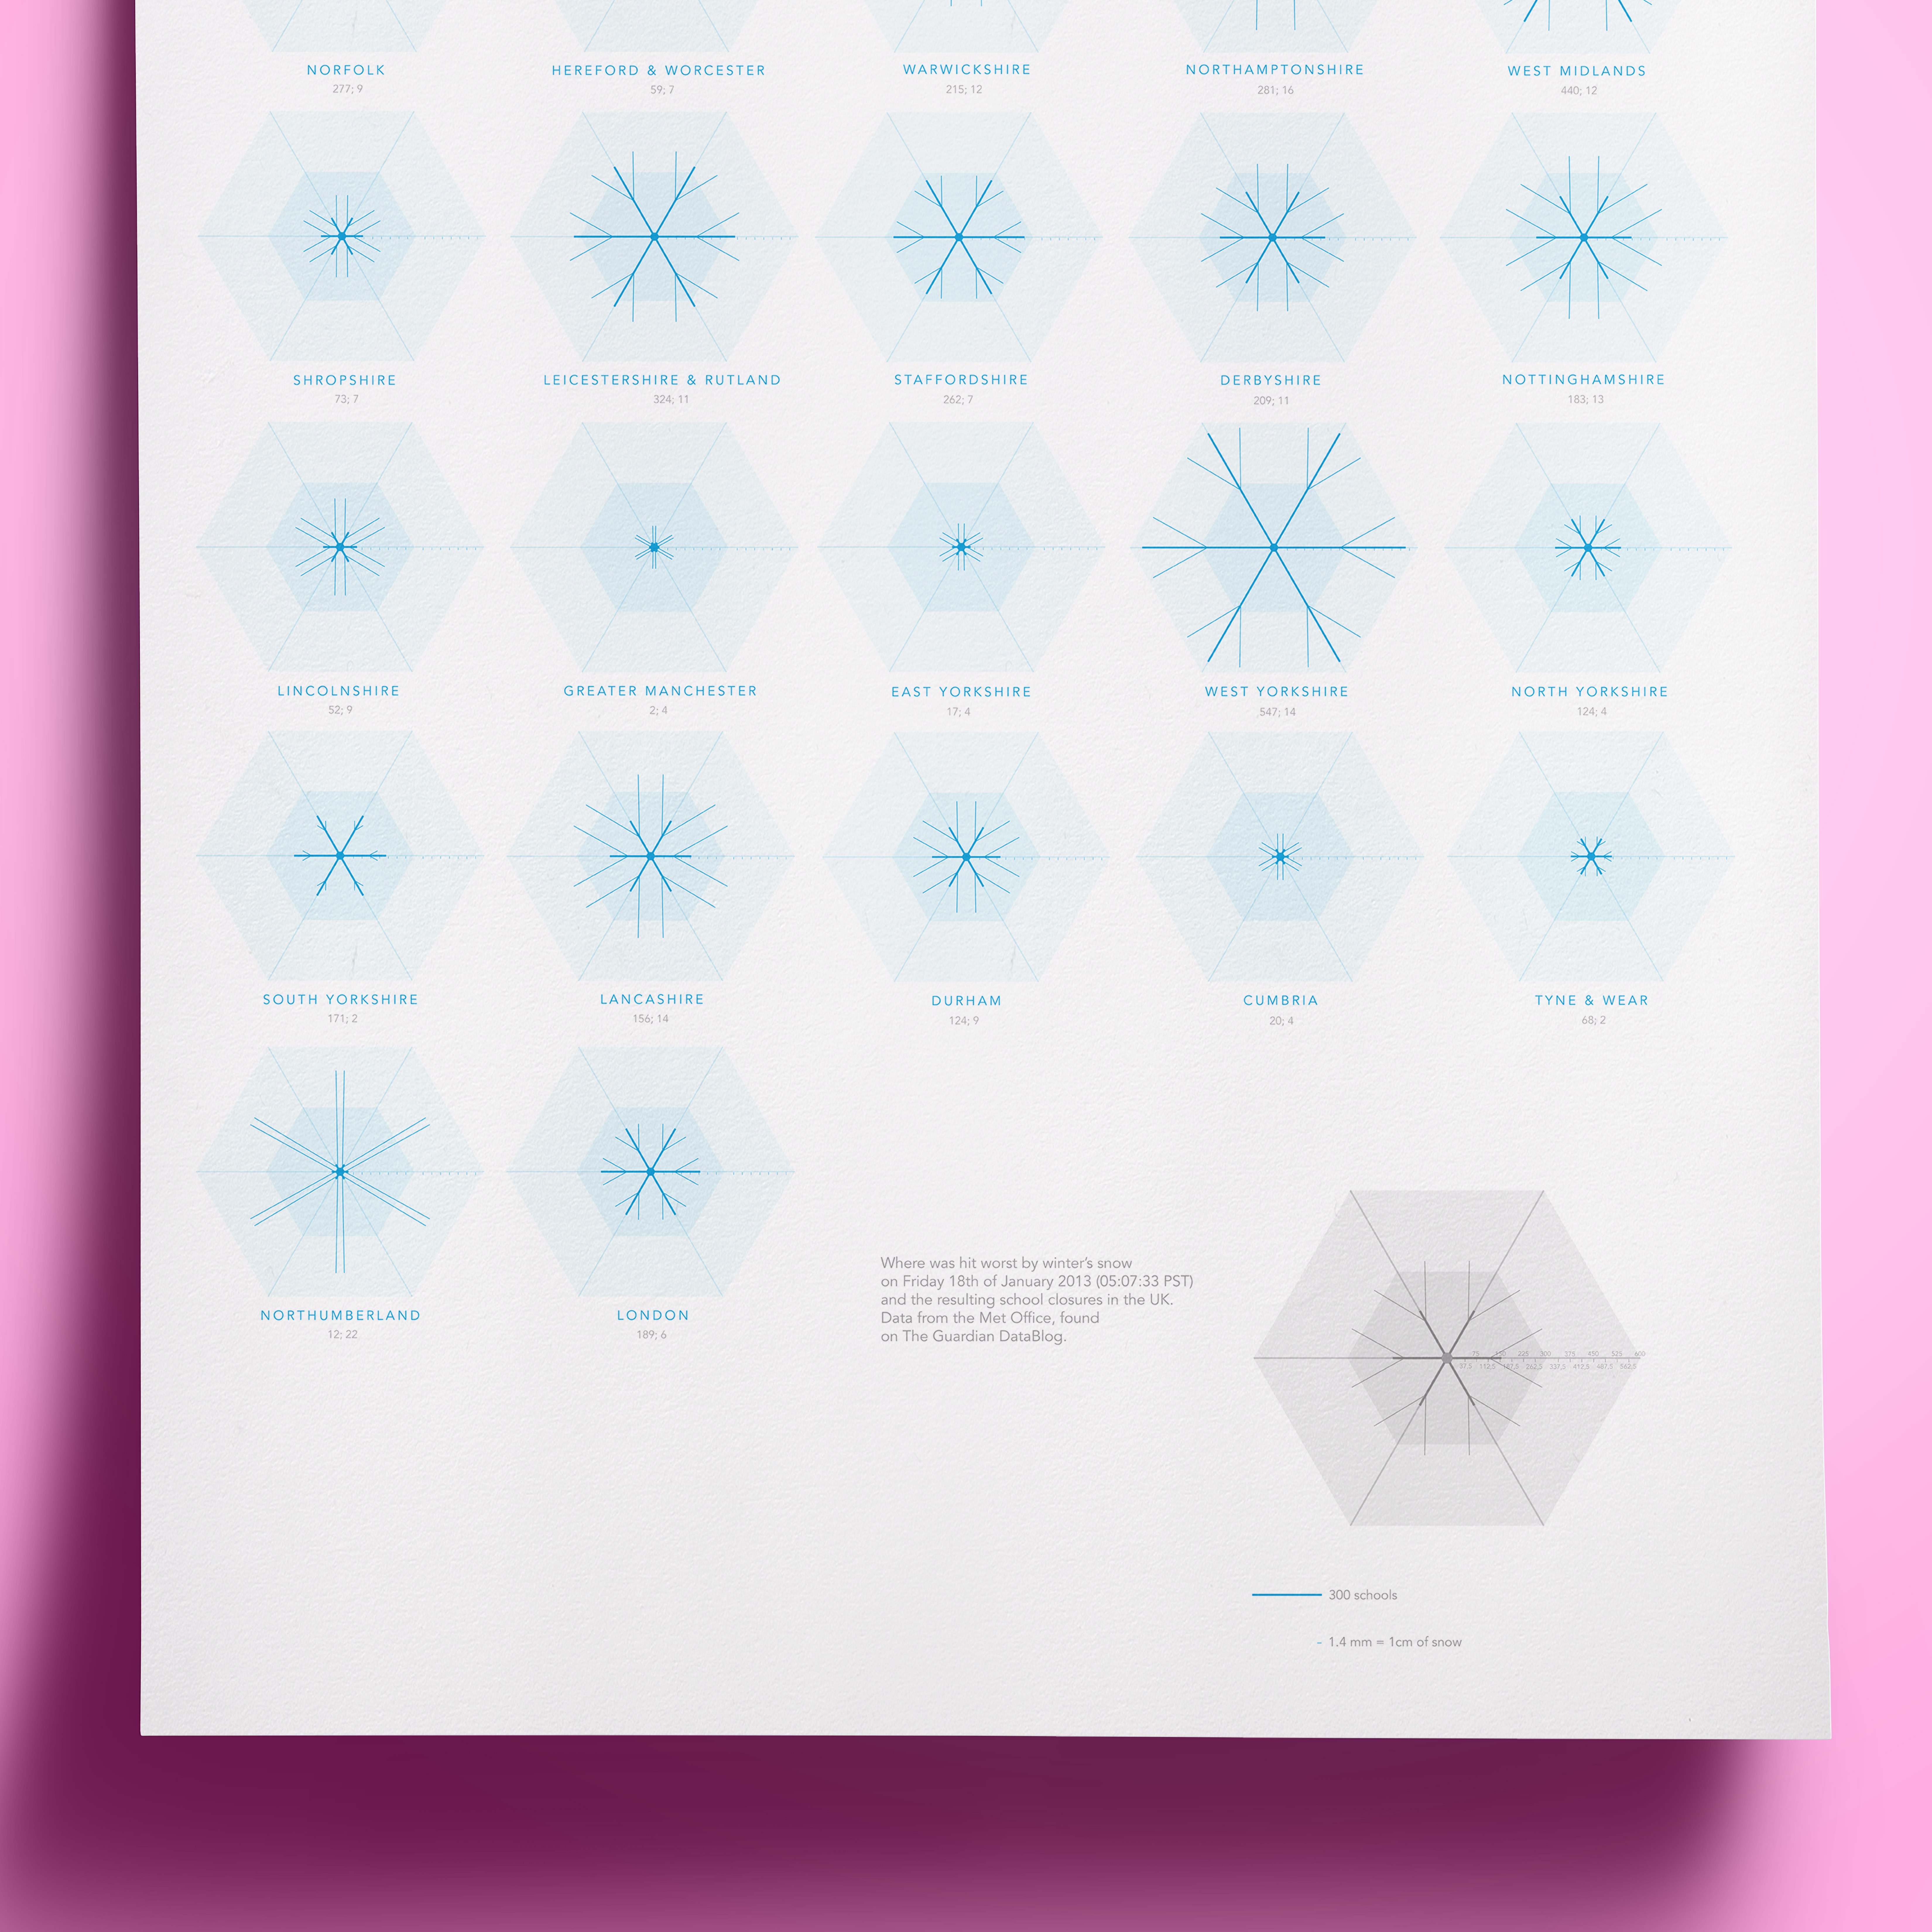
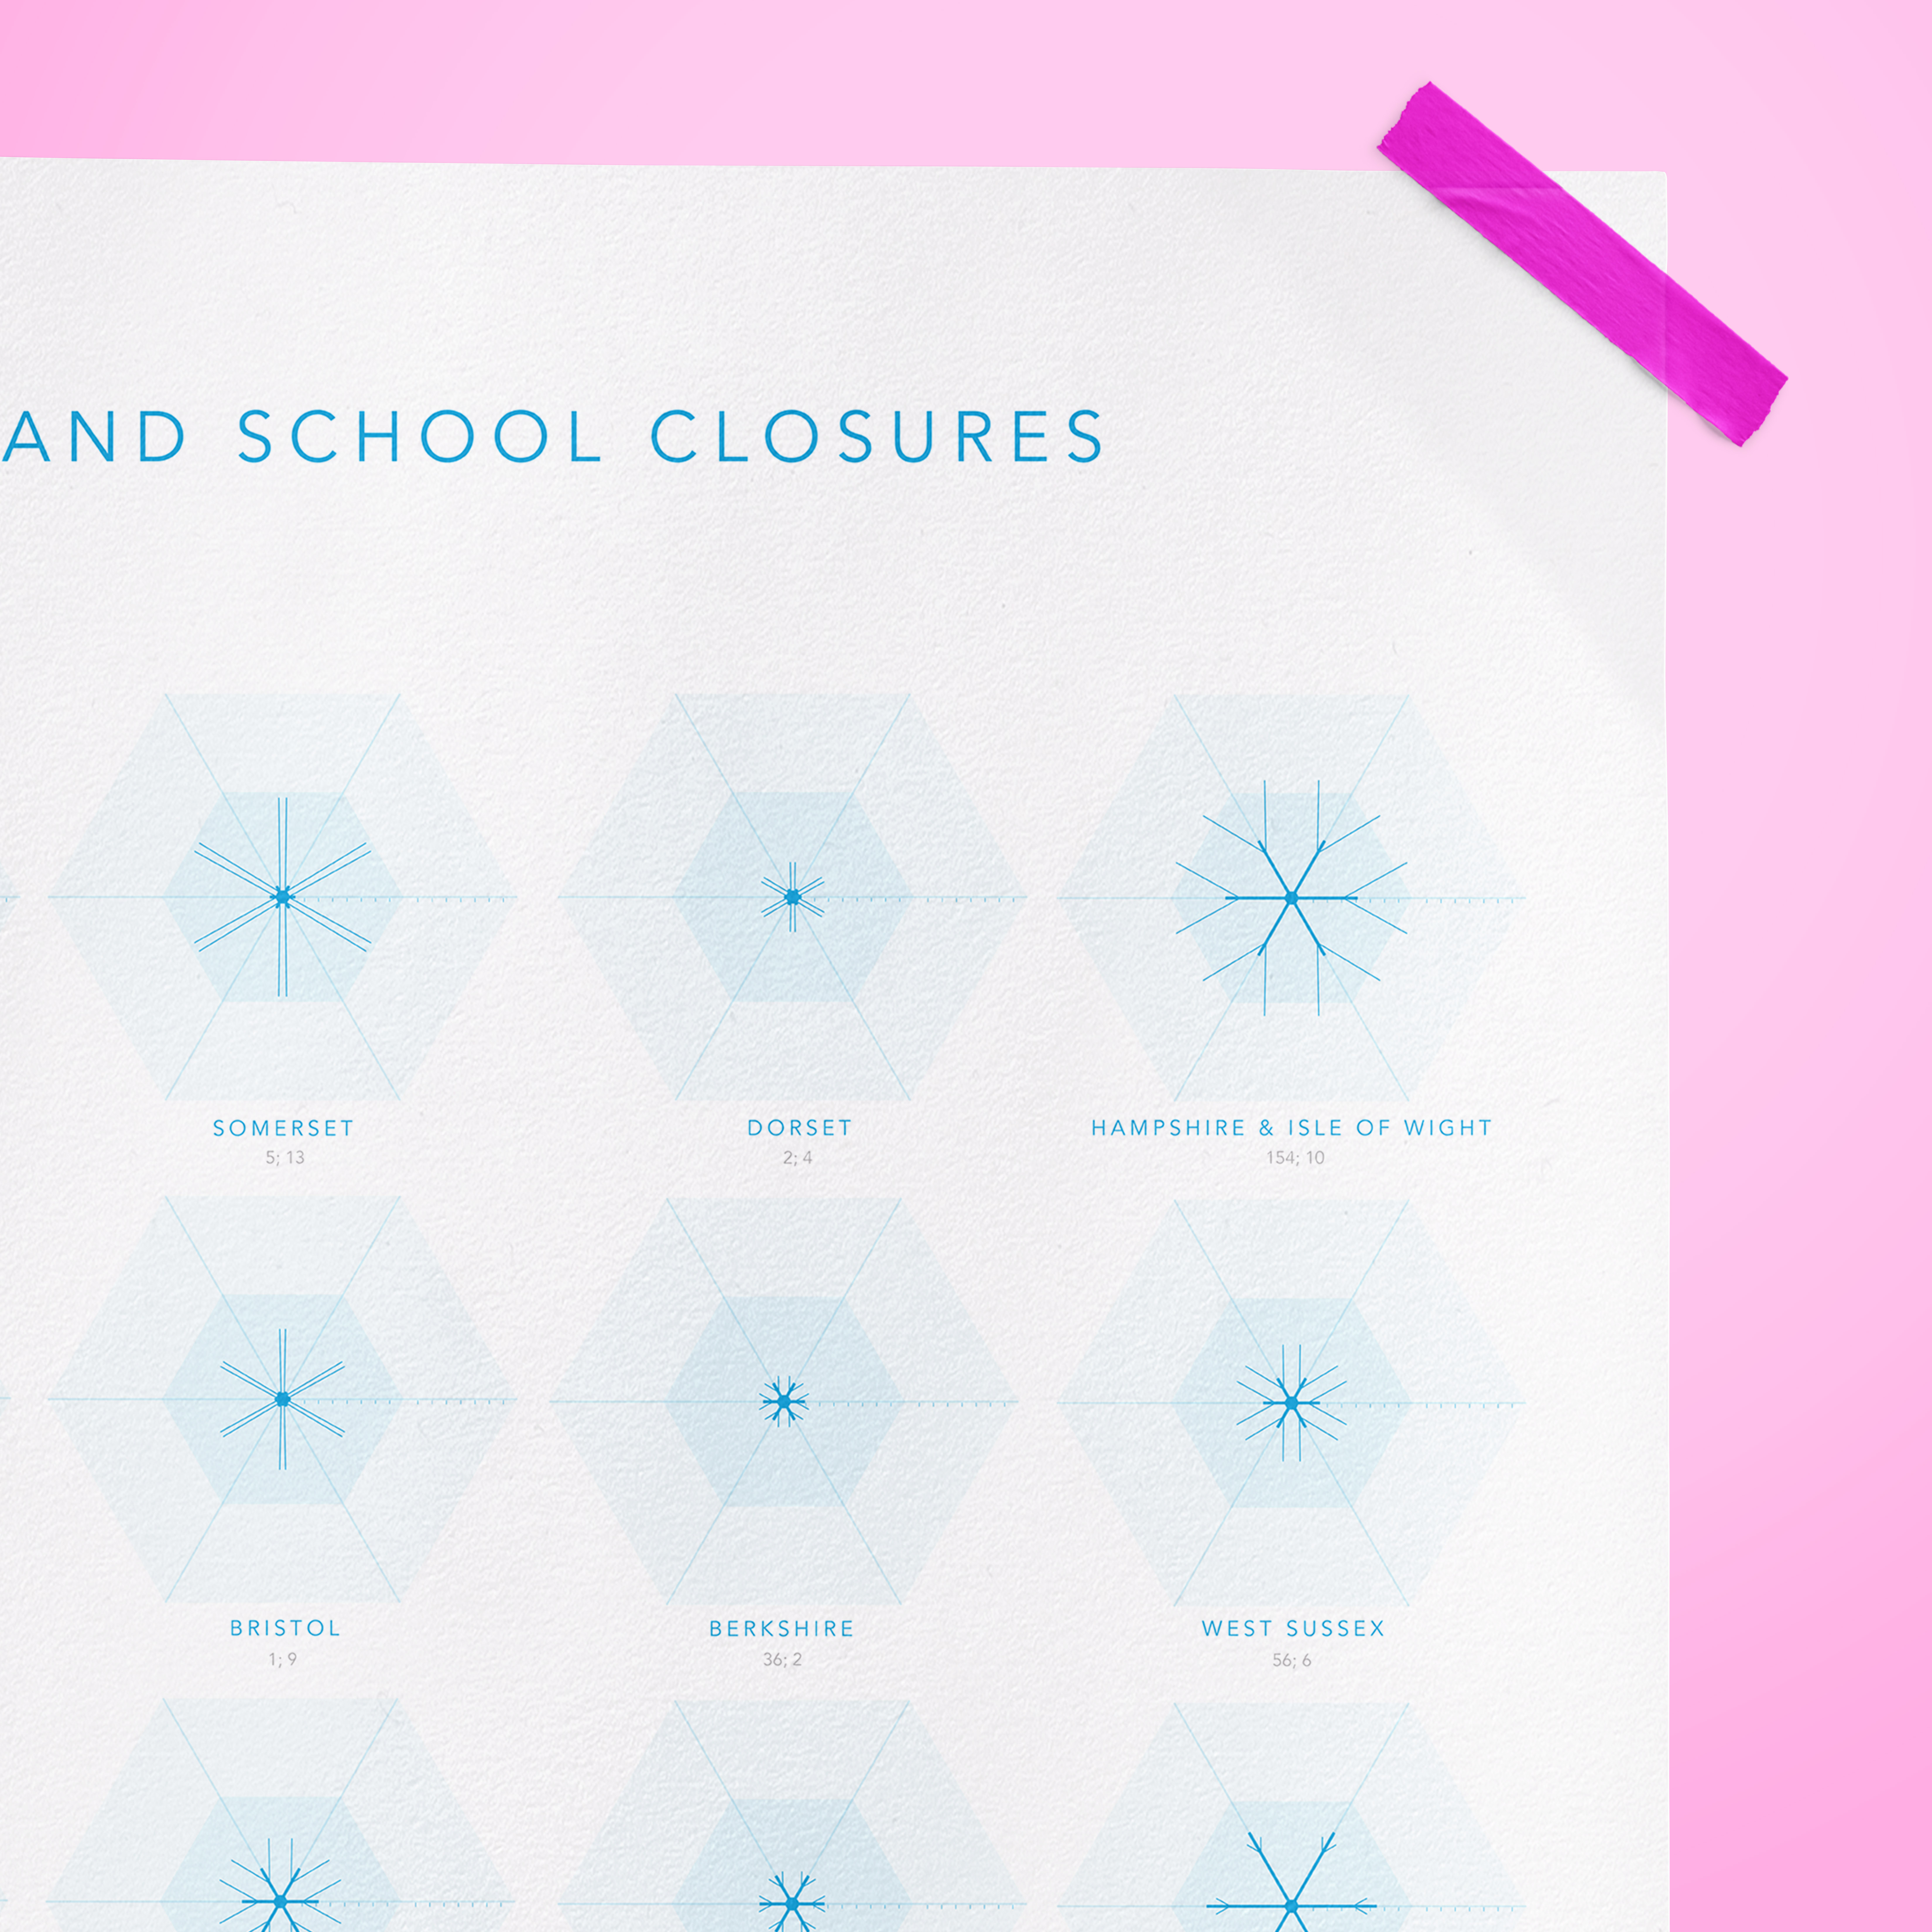
Information design poster showing where was hit worst by winter’s snow on Friday the 18t of January 2013 and the resulting school closures in the UK (data adquired from The Guardian datablog).
Each county in England has been assigned a snowflake that represents two data sets: centimeters of snow (thin lines) and numbe of schools closed (thicker lines). These lines have been repeated in a diameter creating a whole snowflake.
This visualisation makes it easy for the viewer to spot trends like, for example, which counties are more used to snow and which are more likely to freak out.
Poster dimensions are 60cm x 120cm